HeatmapChart
CompleteGrid of cells whose intensity shows the value. Text and intensity are chosen to keep the contrast in both themes.
Example
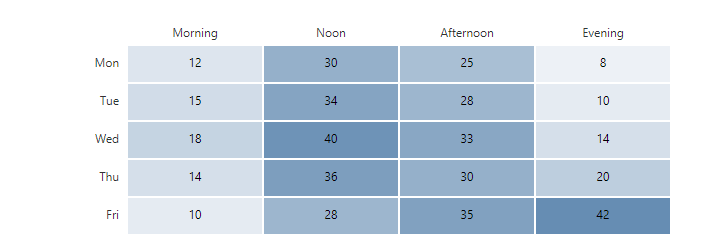
Parameters
| Parameter | Type | Description |
|---|---|---|
Class | string | Extra CSS classes added to the root element. |
Columns | IEnumerable<string> | Column labels. |
Data | IReadOnlyList<IReadOnlyList<Double>> | The numbers: one list per row. |
Height | Double | Maximum height of the grid body, for example 24rem (default 28rem with VirtualScroll). |
Label | string | Visible label text (charts: accessible name; IconButton: accessible name and tooltip). |
Rows | IEnumerable<string> | Row labels. |
ShowDataLabels | bool | Writes the value on each mark (bars, line points, pie slices). |
ShowExport | bool | Adds buttons that save the chart as a PNG or SVG image. |
ShowLegend | bool | Shows the clickable legend. |
ShowValues | bool | Writes the value inside every cell (default true). |
Style | string | Inline style added to the root element. |
ValueFormat | string | Number format for axis and tooltips, e.g. N0 or P1. |
Width | Double | Skeleton: any CSS length. Charts: drawing width in SVG units (the chart still scales to its container). |
Package
HeatmapChart is part of RayCraft Complete. Package: RayCraft.Blazor.Complete. It comes from the private RayCraft feed and needs an active license. See Getting started.
Send feedbackVersion 1.0.3