BoxPlot
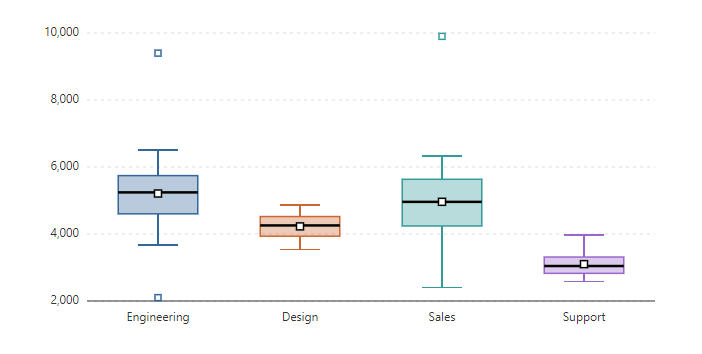
CompleteThe spread of a group of numbers. The box is the middle half, the line is the median, the whiskers reach the furthest value within 1.5 times the box height, and single squares are outliers.
Example
Parameters
| Parameter | Type | Description |
|---|---|---|
Class | string | Extra CSS classes added to the root element. |
ColorByGroup | bool | |
Groups | IEnumerable<BoxPlotGroup> | |
Height | Double | Maximum height of the grid body, for example 24rem (default 28rem with VirtualScroll). |
Label | string | Visible label text (charts: accessible name; IconButton: accessible name and tooltip). |
ShowDataLabels | bool | Writes the value on each mark (bars, line points, pie slices). |
ShowExport | bool | Adds buttons that save the chart as a PNG or SVG image. |
ShowGrid | bool | Draws horizontal grid lines. |
ShowLegend | bool | Shows the clickable legend. |
ShowMean | bool | |
Style | string | Inline style added to the root element. |
ValueFormat | string | Number format for axis and tooltips, e.g. N0 or P1. |
Width | Double | Skeleton: any CSS length. Charts: drawing width in SVG units (the chart still scales to its container). |
Package
BoxPlot is part of RayCraft Complete. Package: RayCraft.Blazor.Complete. It comes from the private RayCraft feed and needs an active license. See Getting started.
Send feedbackVersion 1.0.3